")
Since 1989, S.L.A.A. Fellowship-Wide Services (F.W.S.) has conducted a series of membership surveys designed to better understand the fellowship and its evolving needs. These surveys serve as a cross section of members’ demographics, experiences with the program, sobriety, sponsorship, and the impact of S.L.A.A. on their lives.
The 2025 Membership Survey was open throughout the entire calendar year and achieved the highest level of participation of any survey conducted to date. A total of 2,007 members responded, with more than 1,400 completing the survey in full. This strong engagement reflects the effectiveness of our outreach efforts and enhances our understanding of how F.W.S. can best serve the fellowship and support its continued growth.
S.L.A.A. Fellowship-Wide Services — 2025 Membership Survey
Who We Are & How the Program Works
Since joining S.L.A.A., 96% of members report an improvement in their lives.
Since joining S.L.A.A.
96%
of members report an improvement in their lives.
in S.L.A.A.
of service
counseling after joining
Our Current Membership
Who are our members?
Here is a short snapshot of our current fellowship based on the survey respondents.
Race & Ethnicity
8.2% of respondents identified as Hispanic.
Gender & Sexual Orientation
Gender identity
Sexual orientation
Education & Relationship Status
Education level
Relationship status
Legal Civil Status
Legal civil status
Where our members are from
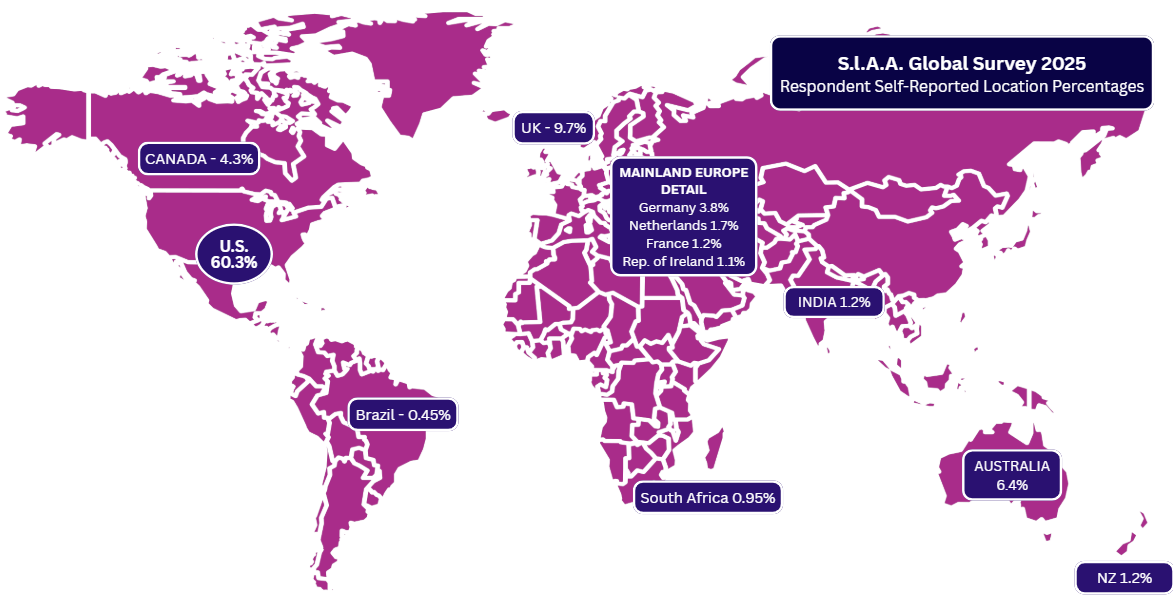
Respondents represented more than 35 countries. For more about S.L.A.A., visit The Core Documents of S.L.A.A.
Occupation
Additional categories: Educator (7.9%) · Manager / Admin / Executive (7.5%) · Science / Tech / Engineer (6.1%) · Arts (5.9%) · Unemployed (5.8%) · Student (3.8%) · Service worker (3.3%) · Semi-retired (3.1%) · Clerical / Office worker (2.8%) · Governmental / Military (2.3%) · Craftsperson / Laborer (2.0%)
1,981 respondents answered this question.
Disability status
Conditions reported (multi-select — share of all 1,746 who answered)
A respondent may appear in more than one category.
Section 1
Coming to S.L.A.A.
How members found S.L.A.A.
People find their way to S.L.A.A. in many different ways. Responses reflect the following key trends:
Most influential sources
Least influential sources
Most members found their way to S.L.A.A. through personal connections and other recovery communities — not through formal institutions.
Section 2
Recovery in action
This section presents respondents’ experiences in recovery within S.L.A.A., reflecting the diversity in length of membership, involvement in service, and participation in other fellowships.
Sobriety snapshot
Section 3
How S.L.A.A. has helped
Sex and love addiction touches every area of life. The survey asked members which areas had been affected — and the breadth of the response reflects just how transformative recovery through S.L.A.A. can be. Members who have found healing in even one of these areas know the freedom that the program makes possible.
How much did recovery enrich each area?
Members rated the improvement in each area on a scale of 0 (no improvement) to 9 (best improvement ever). Figures shown are weighted average scores. 1,407 respondents answered this question.
The S.L.A.A. difference
Recovery in S.L.A.A. is about more than sobriety — it is about how life has been enriched. Members report growth in relationships, spirituality, emotional wellbeing, and a renewed sense of purpose.
The data reflects not just what members have moved away from, but what they have moved toward through the fellowship. Across every area of life that addiction touched, S.L.A.A. has offered a path toward healing.
2025 S.L.A.A. Fellowship-Wide Services Membership Survey — approximately 2,007 respondents. Each data point reflects the responses of members who answered that particular question. Not all respondents completed every question, so the number of responses per item may vary; percentages are calculated from the total who answered each question individually, not from the full survey population. Percentages may not sum to exactly 100% due to rounding or multi-select questions.
The information contained on this page is provided by S.L.A.A.’s Board Outreach Committee. Reprint permission or questions about the survey data should be directed to [email protected].
© 2026 Augustine Fellowship, S.L.A.A., Fellowship-Wide Services, Inc. All rights restricted. Permission to reprint all or part of this page is restricted to those authorized in writing by Fellowship-Wide Services.